
Gallery
The challenge
A tracking engine stores positions and events. A fleet team still has to answer two recurring questions without opening a spreadsheet hunt: how far did these vehicles go, and how much fuel shows against that period. Those answers often live outside the product the dispatcher already uses. Someone exports a raw log, builds a sheet, and pastes totals into an email. The live map stays open in another tab. By the time the file is ready, the period has moved on — and the person who needed the file is waiting on a side process instead of a button in the product. Trip history helps for a single route. It does not replace a Summary roll-up: one place to pick a vehicle, pick dates, see period totals, and leave with a PDF or spreadsheet. ProGPS needed that Summary answer inside the same web product as the map — filterable, readable, and exportable.
Architecture
We built ProGPS for a client: a Laravel web app and a Flutter app for Android and iOS, both on Traccar's standard tracking APIs, with no Traccar server, API or protocol changes. The live overview case study on techmania.solutions covers the full surface. This case study looks at one web feature: the Summary report.
Solution
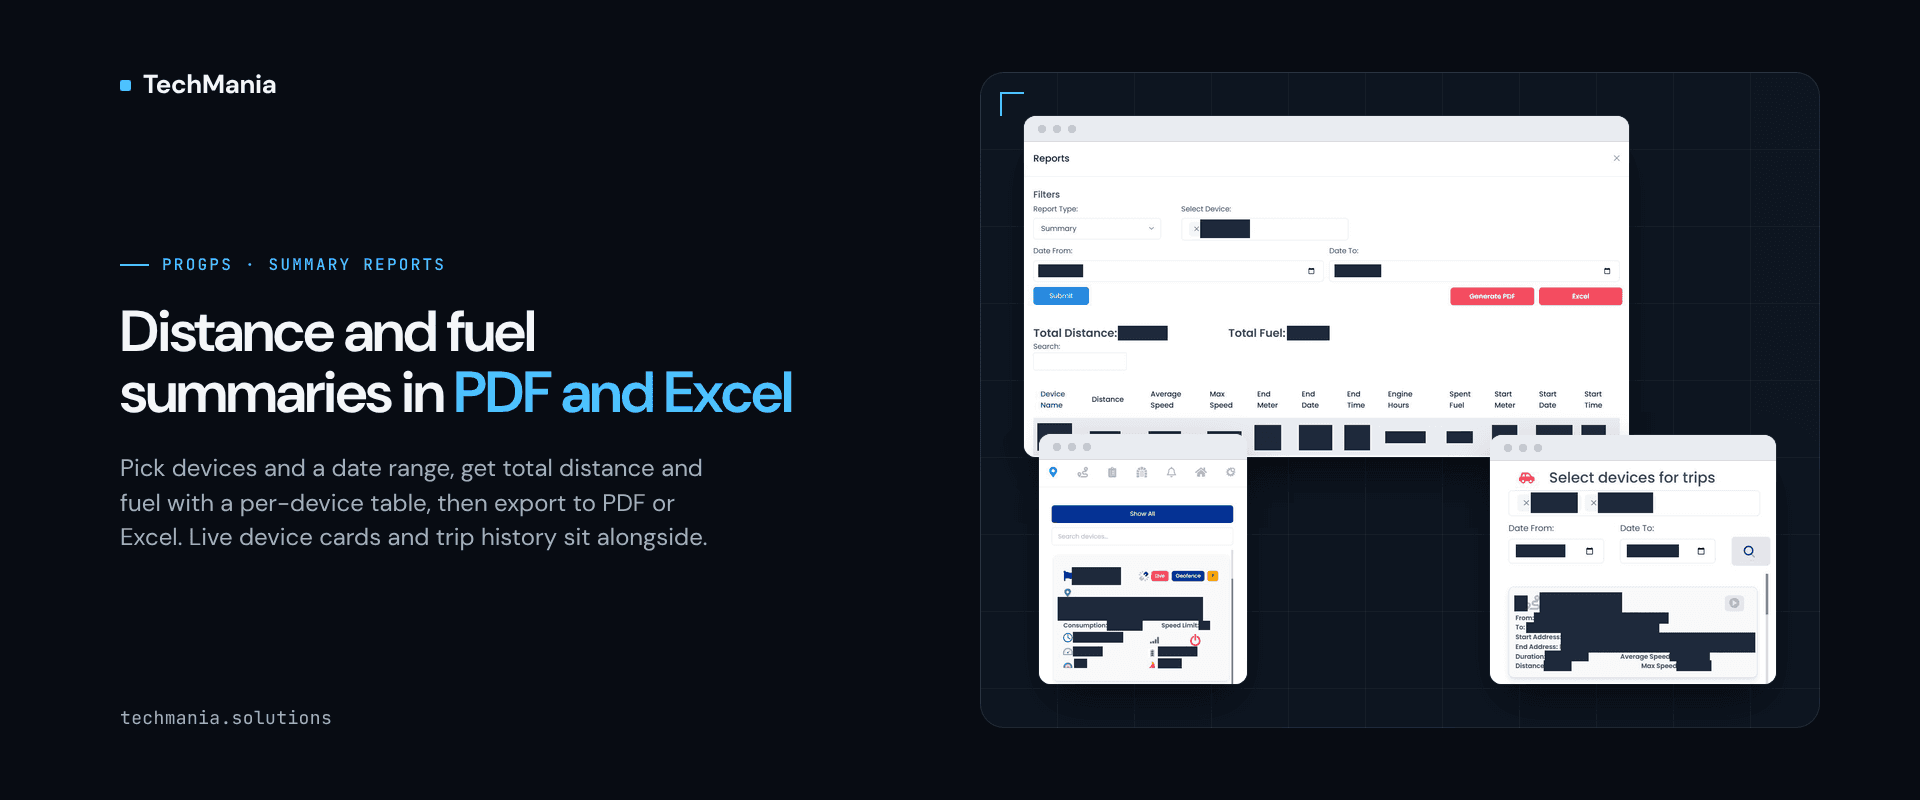
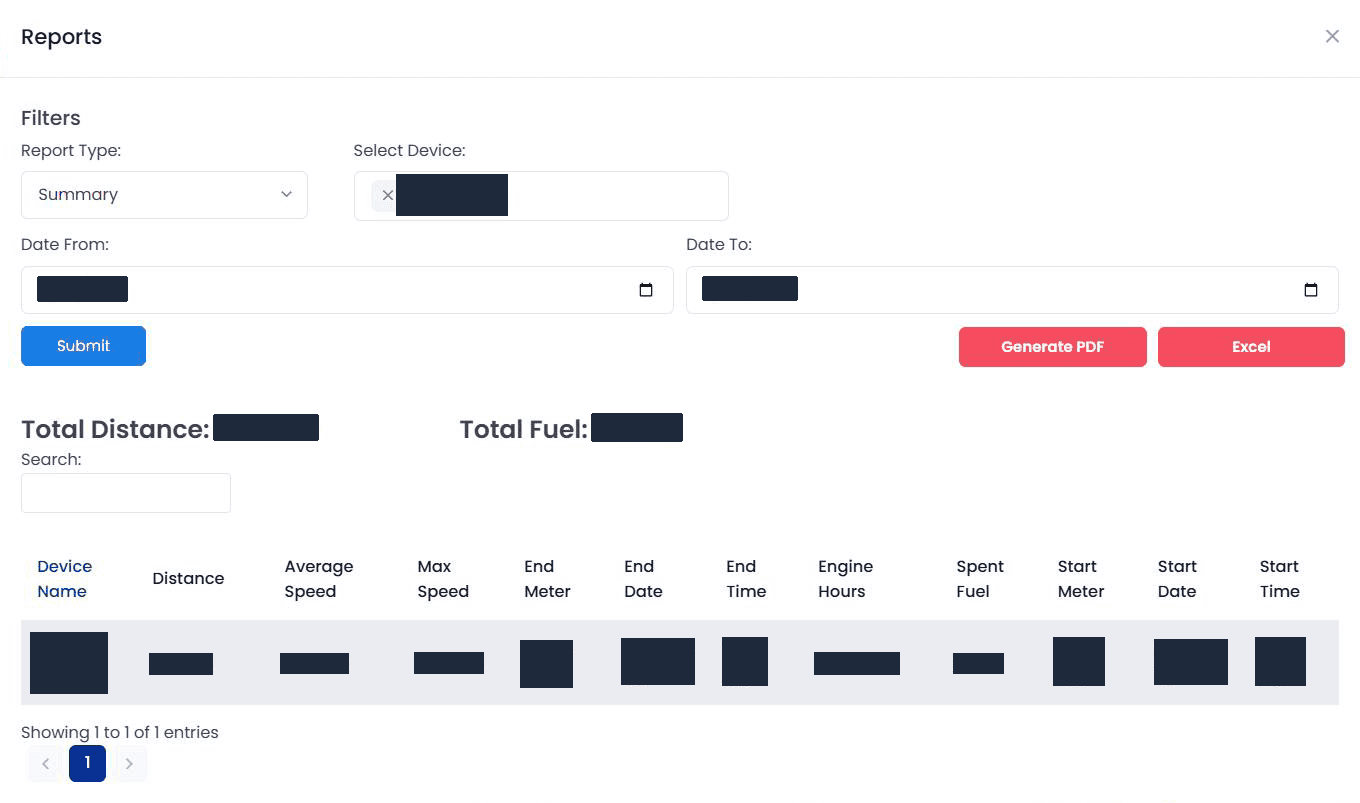
Report type and filters. The Reports window lets the operator choose the report type (Summary), pick a device and a date range, then submit. The period is explicit before any table appears. Totals first. The result leads with total distance and total fuel for that selection, so the period answer is visible before anyone opens a row. That is the difference between a report and a raw event dump. A readable table. Under the totals, the Summary table lists the columns the fleet team expects for the period: device name, distance, average and maximum speed, start and end meter, start and end date and time, engine hours and spent fuel. Search and pagination sit on the same modal when the list grows. Export without leaving the product. From the same window the operator can Generate PDF or export to Excel. The file that goes to a manager or a partner is produced from the report they just ran — not from a side spreadsheet rebuilt every week. Beside the rest of ProGPS web. Day to day, the same Laravel app holds the live map with rich device cards (including consumption and speed limit on the card), geofences, multi-vehicle trip history and ignition / geofence notifications. Trip history answers "what did this vehicle do on Tuesday"; the Summary report answers "what do distance and fuel look like for this selection over this period". Both belong in one product. What we did not change. Tracking still comes from Traccar's standard APIs. The work went into the ProGPS reports UI on top — filters, totals, table and export — not into customising the tracking server.
Results
What this Summary surface gives the client's fleet team: - Distance and fuel for a chosen device and date range in one report window - Totals visible before the detail table - PDF and Excel export from the same screen that ran the report - Period reporting inside the ProGPS web product that already holds the live map and trips - No separate spreadsheet tool required for the basic period roll-up Next step Building a branded fleet product on a tracking engine and need period distance and fuel reports with PDF and Excel export inside the same web app as the live map? See ProGPS (https://techmania.solutions/portfolio/progps) or talk to us at https://techmania.solutions
Related project
ProGPS
ProGPS: Laravel web and Flutter iOS/Android apps we built for a client in Romania on Traccar's standard APIs: live tracking, geofences, trips, fuel reports.
View project in portfolio